Using maps to tell stories, inform and entertain
We ❤️ maps! Done right we think they’re a brilliant way to creatively present information – here are some examples to prove it.
While digital maps are a part of everyday life, they’re probably not the first thing people consider when thinking about creative communication. But any time we’re working with information with a geographical component, we start pondering over how a well put together map could bring the data to life.
Digital maps are ubiquitous, so panning, zooming and clicking on markers are all things most people are familiar with – this creates a shallow learning curve but also an increased willingness among users to ‘play around’ with a map. This is one of the key things that makes maps such a great choice for creative communication.
We’ve used maps in many of our projects, from standalone full page experiences to embedded maps that form a small part of a much bigger site. Below are some of our favourite examples.
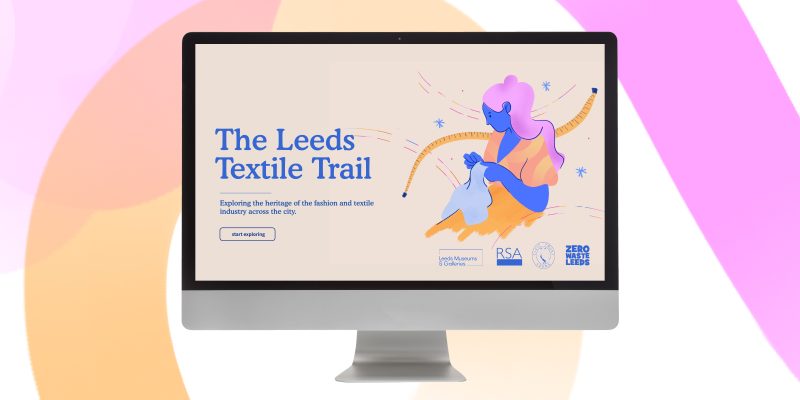
Exploring a city’s cloth-based heritage
The RSA
Undertaken as part of a broader campaign to engage people with the history of textiles in Leeds, the aim of this map was to connect people to their city’s great textile legacy, therefore encouraging them to take pride in quality clothing and furthering the backlash against fast fashion.
The Leeds Textile Trail brought a diverse range of stories to life, from the 1970 clothing strike in which 20,000 Leeds workers fought for better pay, to the humble origins of Marks & Spencer through its penny bazaar in Leeds Kirkgate Market.
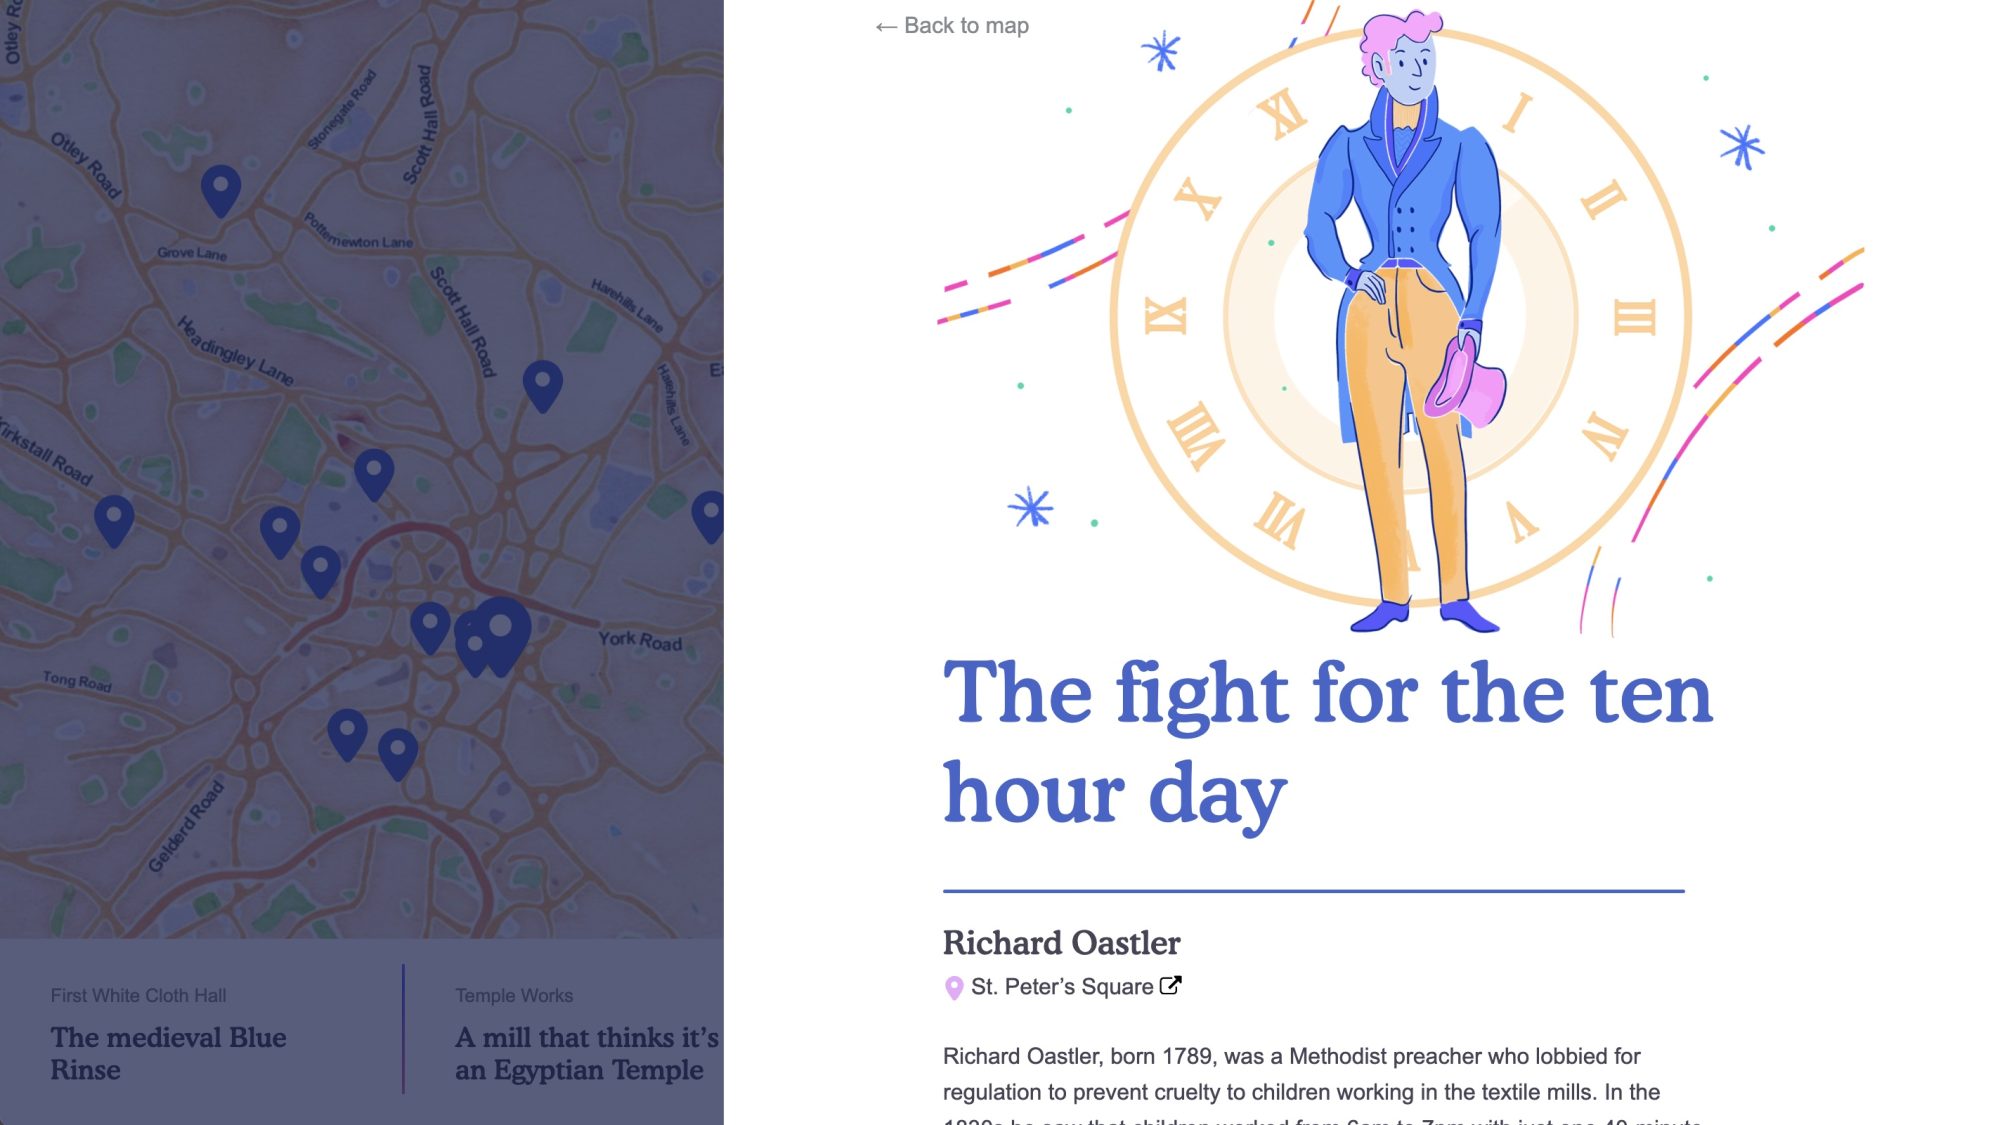
We created vibrant illustration for each of the fifteen stories to help capture people’s imagination, and brought them together on an interactive map that combined the playful drawings with text, images, video and audio that delved into the detail.
Visit the Leeds Textile Trail →
Mapping the lost cinemas of Leeds
Hyde Park Picture House
We worked with the Hyde Park Picture House and Leeds-based illustrator Adam Allsuch Boardman who together had been documenting every past and present cinema in Leeds. Through some seriously dedicated research they’d unearthed evidence of a total of 83 cinemas across Leeds (significantly raising previous estimates of how many had existed) and Adam had accomplished the impressive feat of illustrating every one for which some evidence of the exterior could be found.
We worked with them to plan, design and build a map that allowed this documented history to be explored, making prominent use of Adam’s amazing illustration to create something that is as playful and entertaining as it is educational and informative.
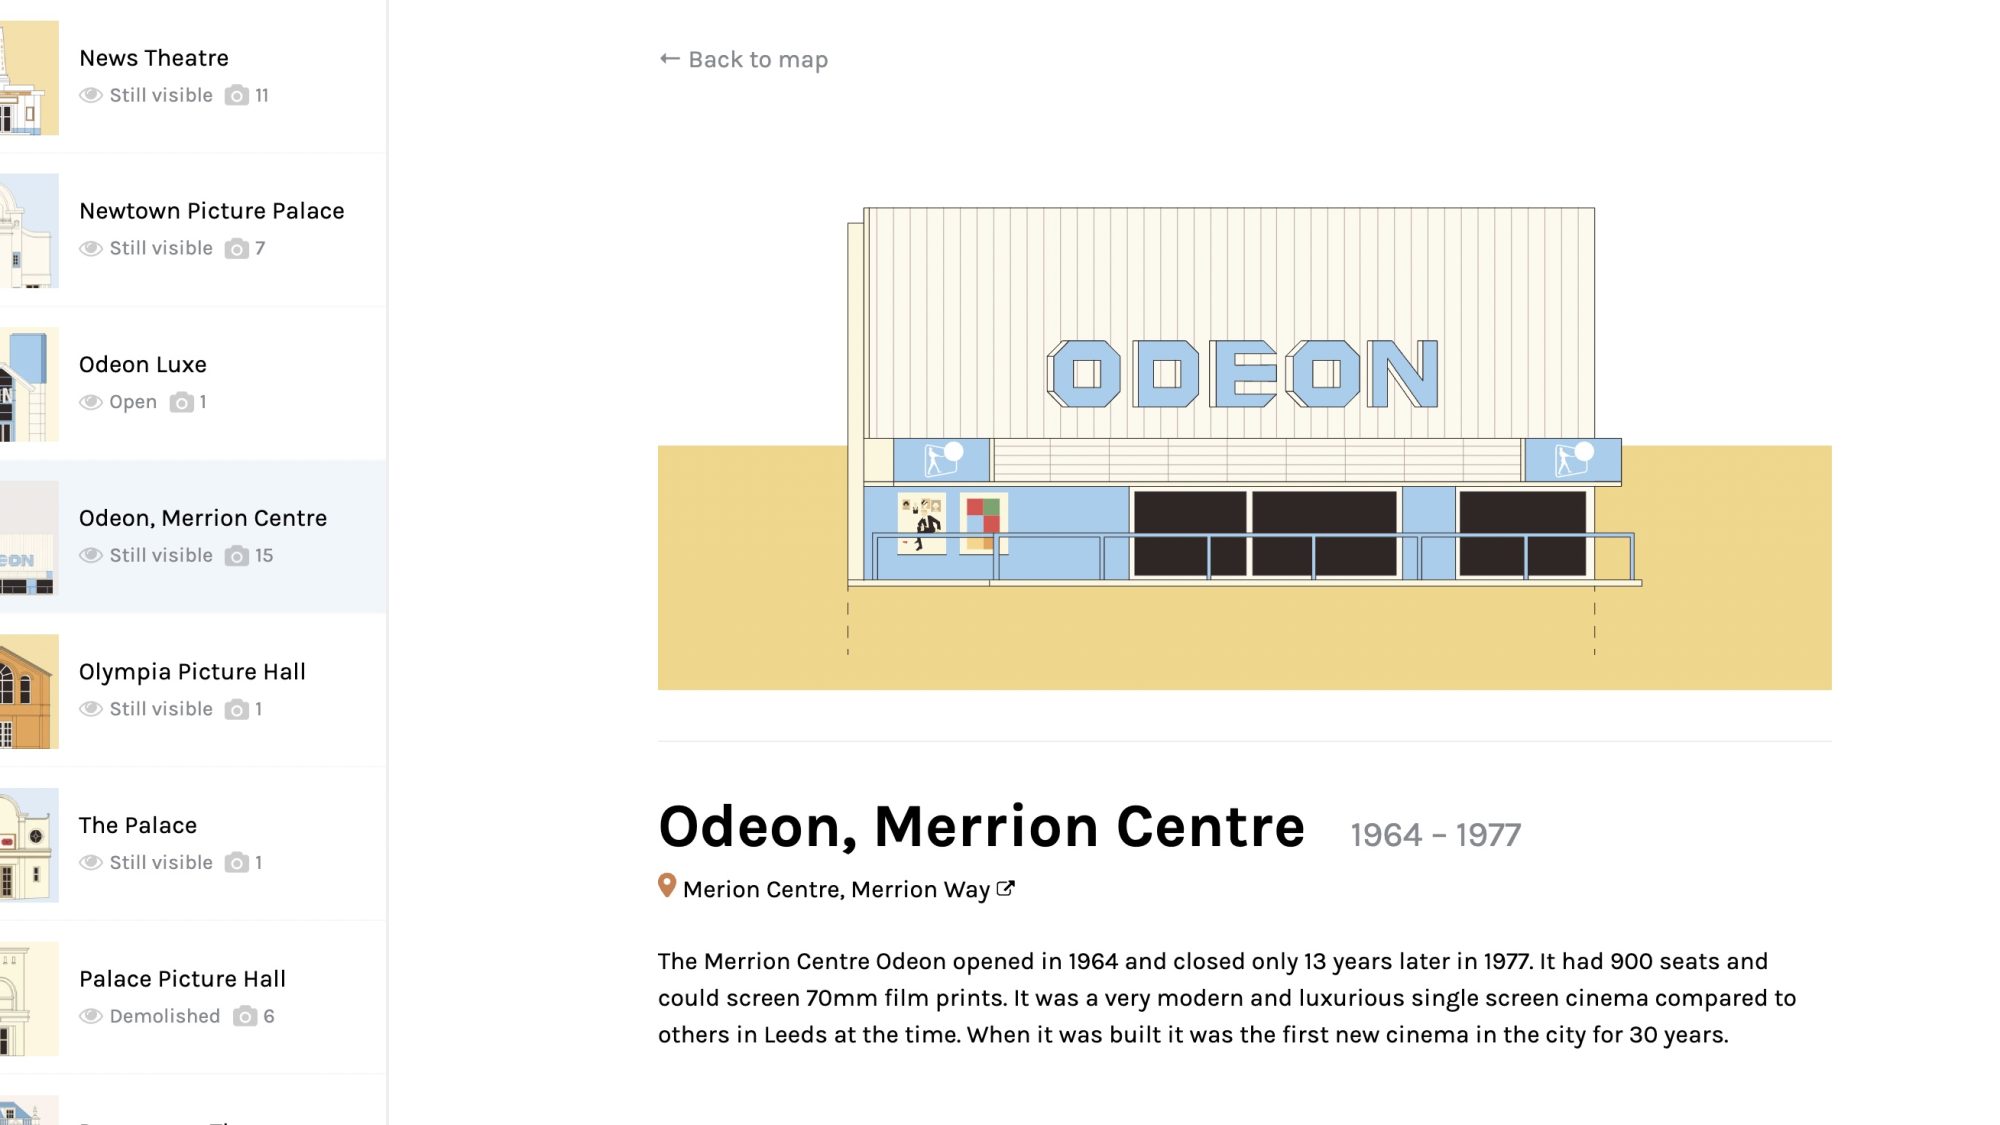
Photos were included along with a call for further photo submissions, and a comment system has allowed people to share their memories – in some cases going back over sixty years. This component of the project turned it into a living, growing record and enabled participation from a large number of people.
More recently we expanded the map to offer a tour functionality that guides people around the city centre locations with accompanying audio. This tour has been undertaken by hundreds of people and additional tours in different areas of the city are now being considered.
Showcasing projects on a giant touch screen
Hubbub
Hubbub wanted a way to showcase a whole range of projects they had delivered which focused on reducing waste from single-use items like coffee cups. We built an interactive map for them to use on a giant touchscreen that made these projects easy and fun to explore.
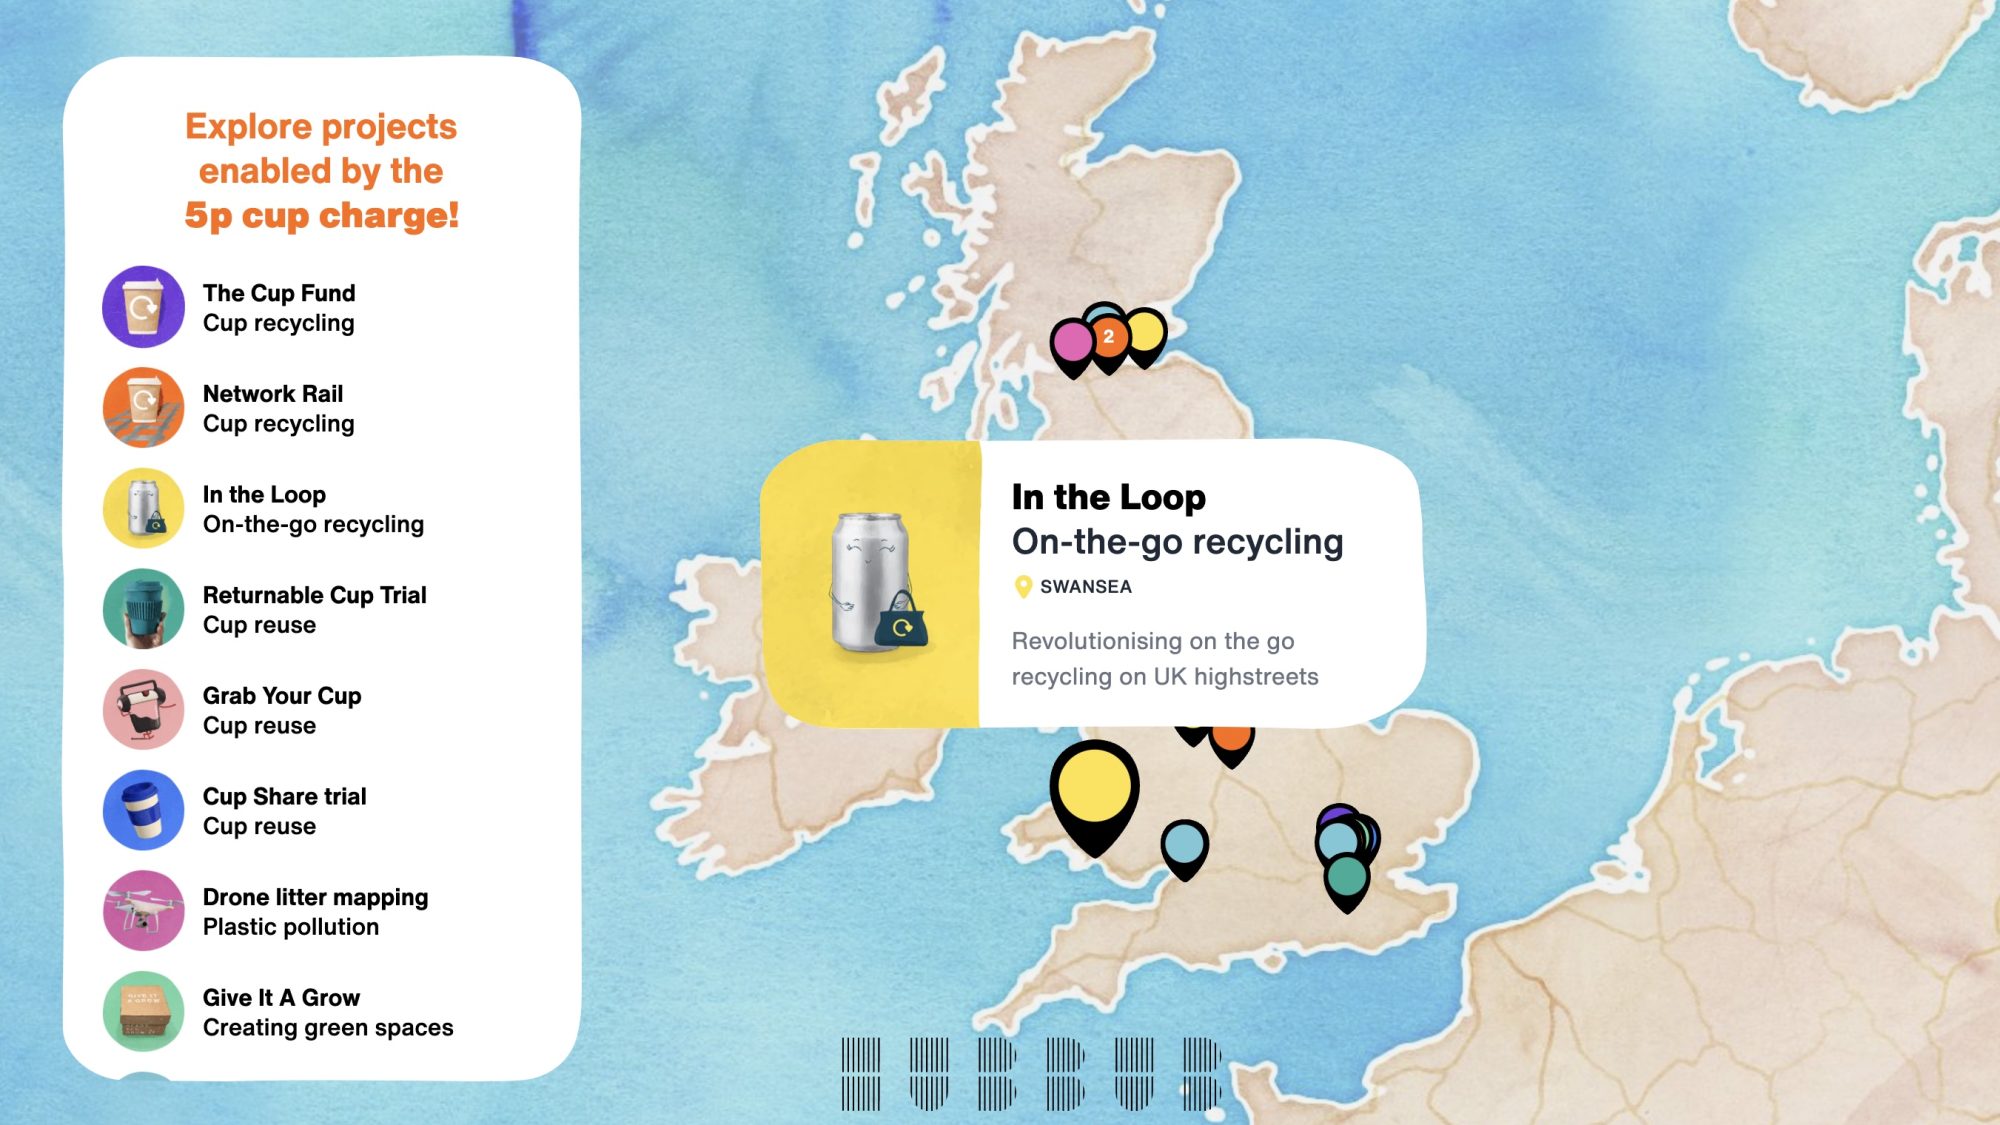
This map was intentionally kept simple to enable it to perform well on a giant screen, but offered features such as marker clustering, filtering and reseting.
Visit Hubbub’s 5p cup charge map →
Bringing the humble bottle bank to life
Zero Waste Leeds
The absence of kerbside recycling in Leeds means the humble bottle bank offers a glass receptacle’s only hope of reincarnation. Bottle banks, though, are fairly opaque vessels, with most of us knowing little about what goes on after a bottle is posted inside. We might know whether a bin is full or not from the sound the bottles make after they’re posted inside, but without knowing how often they’re emptied, or even how many bottles they hold, it’s hard to know if we’re the only one making the effort to cart their glass down to the supermarket carpark each week.
This map aimed to help change all this while also providing a convenient way for people to find their nearest bin. Starting with council-provided data on Data Mill North, we looked up some industry white papers on the energy savings delivered by glass recycling, crunched the numbers and converted them into some relatable figures that would mean something to the average person. So 3,455kg of glass became 618 mobile phones powered for a year, while 514,363kg of glass became 45 houses powered for one year.
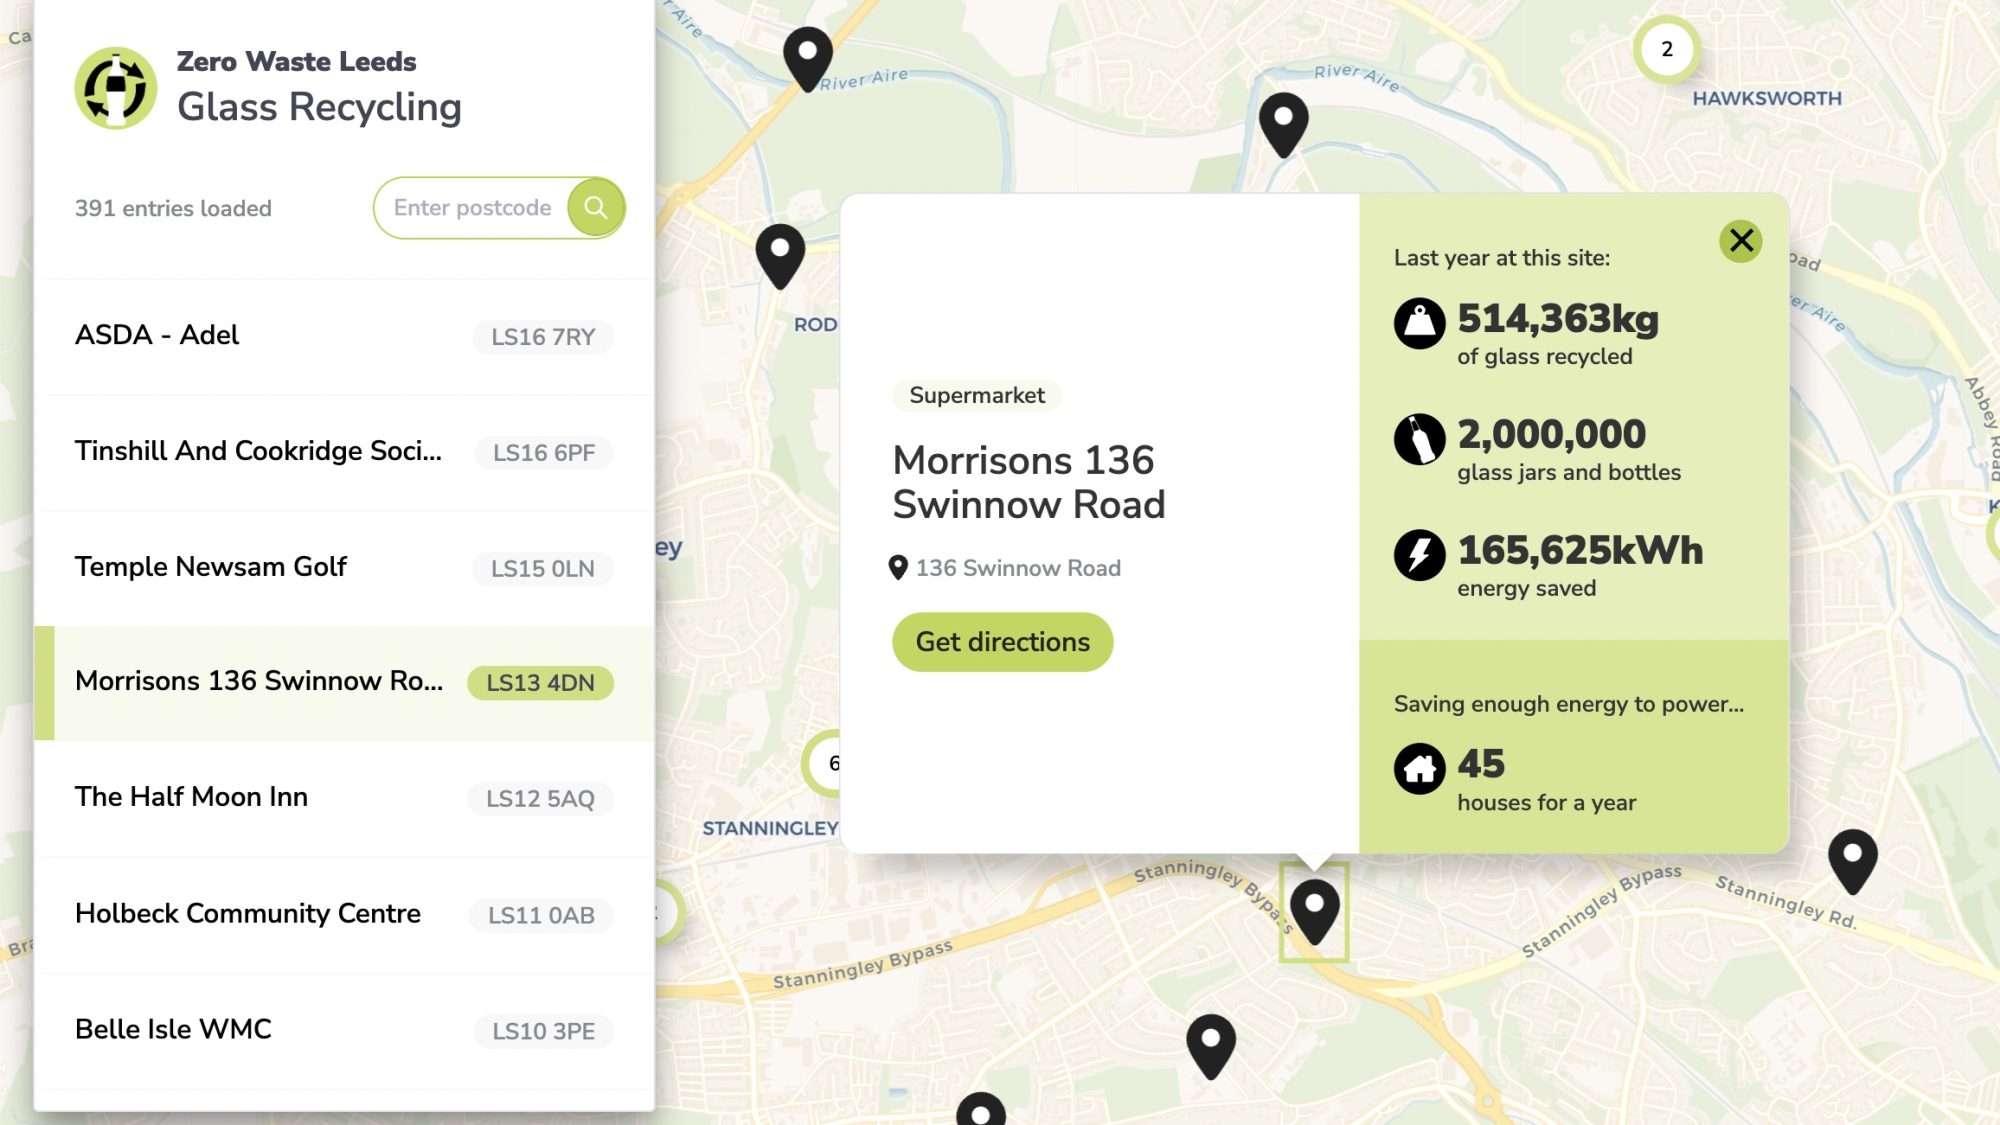
As well as these helpful statistics about each bottle bank’s usage, the map incorporated a postcode search allowing users to view the banks near to them, and integration with Google Maps allowing users to get directions to a specific bin.